Dashboard
A crypto portfolio at a glance
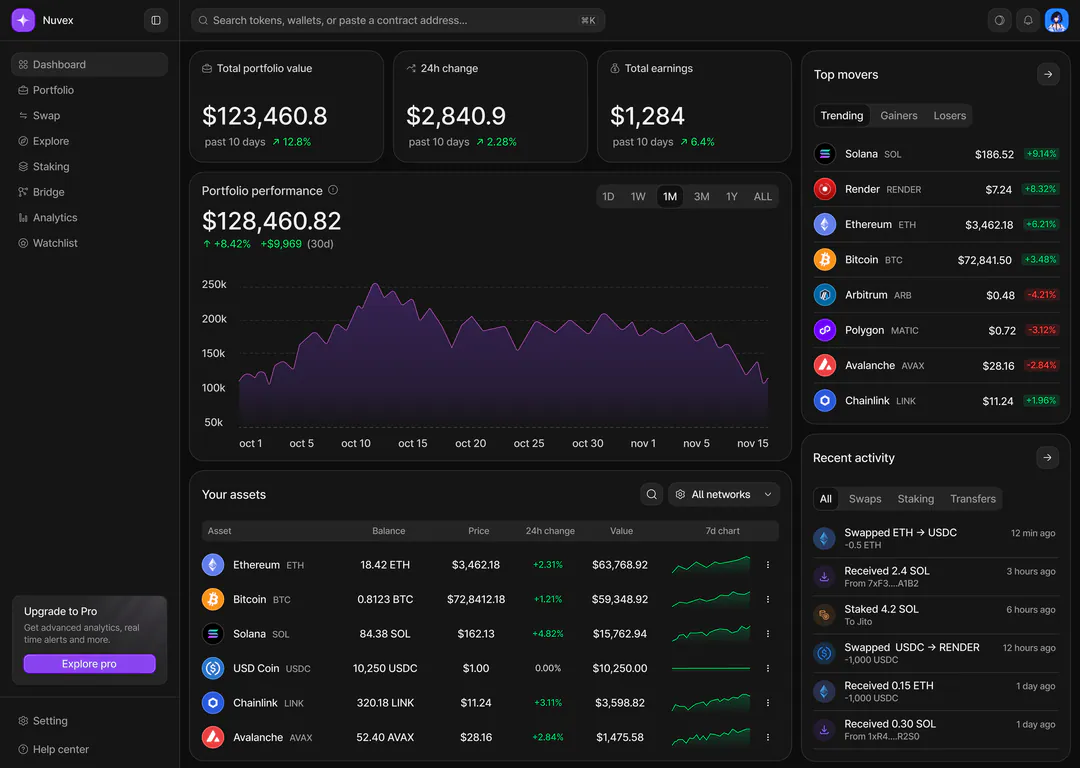
Nuvex is a crypto portfolio tracker I designed from scratch. The dashboard answers three questions in order: what my holdings are worth, what’s moving, and what just happened.
OriginalOverview
- What it’s for
- Tracking a crypto portfolio across networks: total value, daily change, earnings, every holding, and recent swaps, transfers and staking.
- Who uses it
- People holding a handful of tokens who check in daily. They want their total and anything unusual first, and the details only when they go looking.
Close-ups
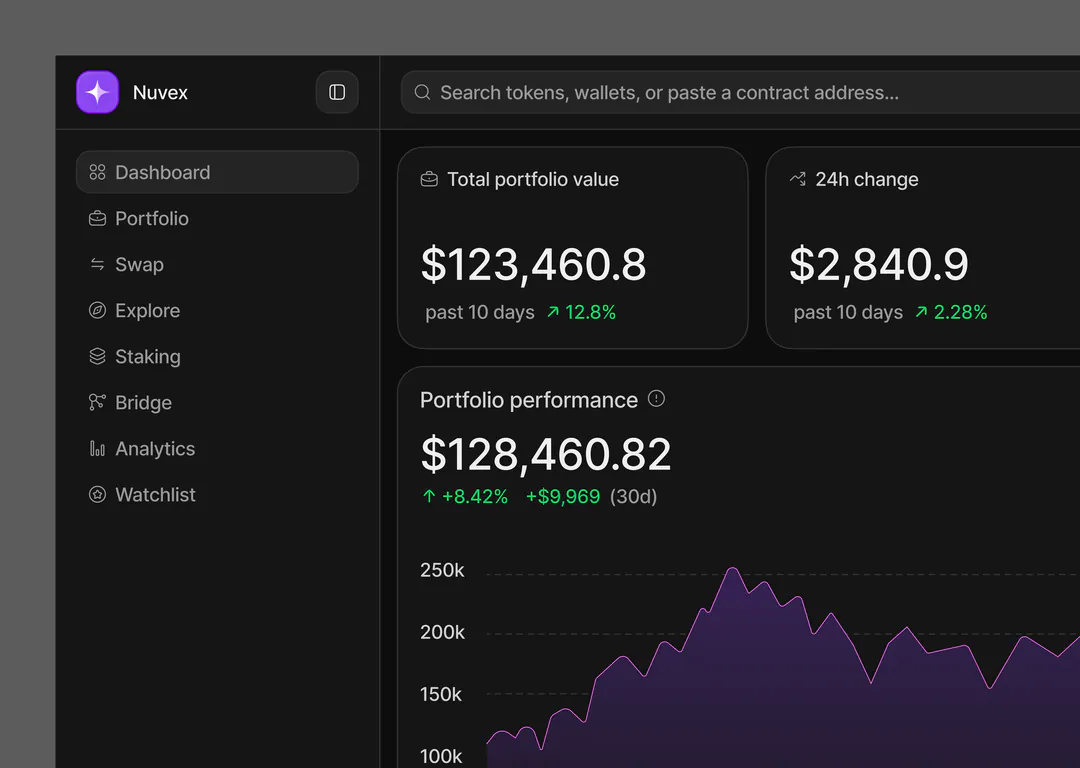
01/03Totals first, always with context
The three totals lead the page in large type, and each one carries its period and its change right underneath, so no number ever appears on its own. The sidebar stays quiet in grey, with one highlighted item.
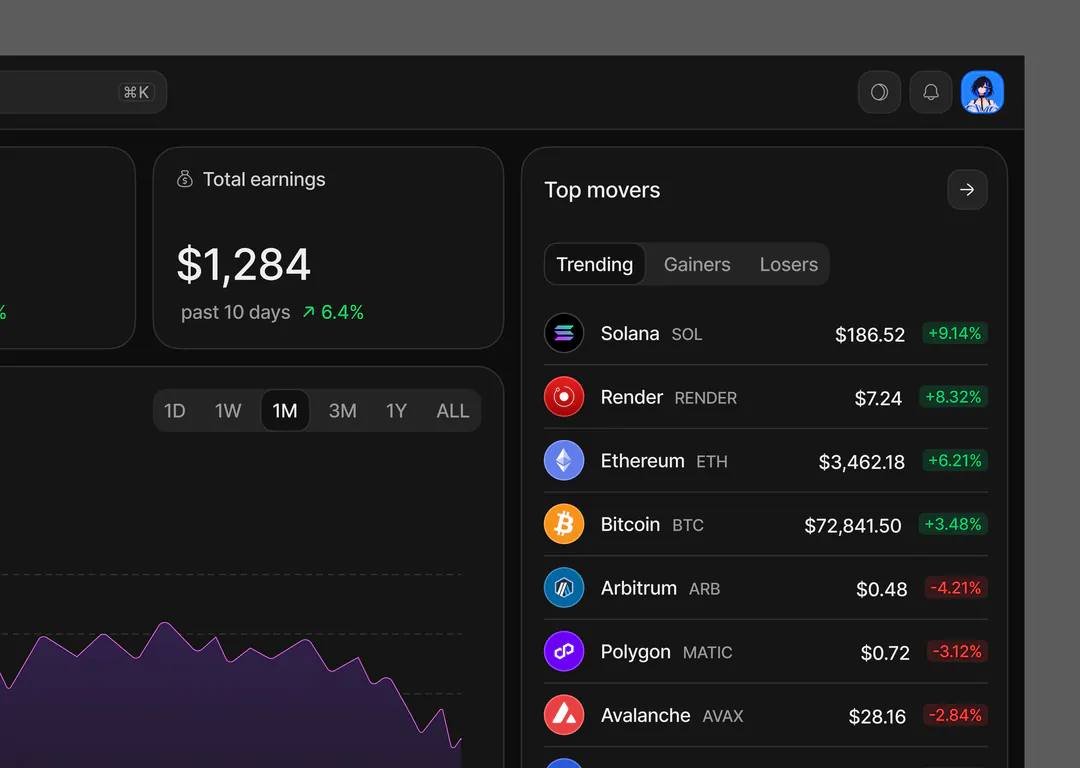
02/03A market list built for scanning
One row per token: icon, name, ticker, price, change. Changes keep their + or − sign inside the green or red pill, so they still read without colour. Tabs filter the same list instead of adding three more panels.
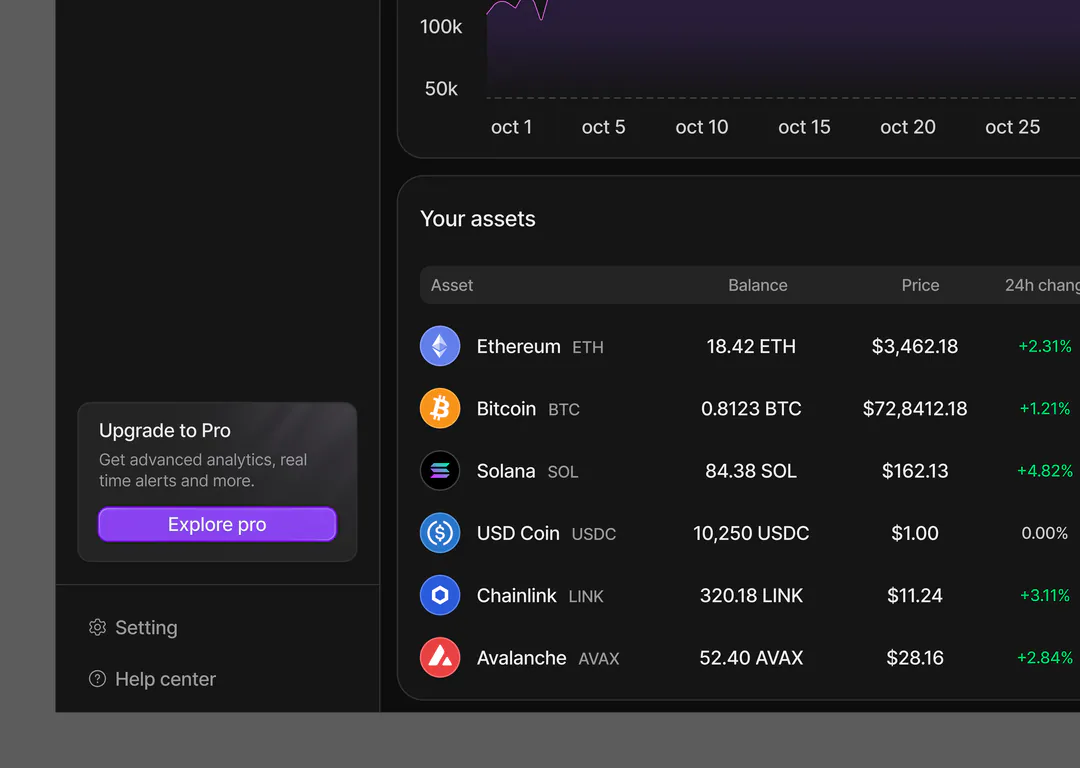
03/03A table you read left to right
Columns run from what you hold to what it’s worth, ending in a 7-day sparkline so the trend shows without opening a token. The upgrade prompt lives at the foot of the sidebar, away from the data.
What I’d test next
- 01Whether “Total earnings” is understood the same way by everyone: realised or unrealised?
- 02How people find one token: the search bar or scrolling the assets table.
- 03Contrast of the smallest grey labels on the dark surface, measured, not eyeballed.